Volatility Related to Politics and Soybeans:
Tomorrow, November 6th, is for the United States, election day. On Friday (02NOV18) – the USA President only hinted that his staff could be drafting a trade deal with China. Within the next 30 minutes, soybean prices advanced over 30 cents, and corn +7 cents. Larry Kudlow, now the Director of the National Economic Council under President Donald Trump – just four hours later publicly stated that no such trade agreement was being drafted at the White House. (” …the cabinet was not asked to draw up a trade deal with China….”.) Then, 3 hours later Kudlow stated, “Satisfactory Deal’ With China Could Lead to Lifting of Tariffs…”
Without being the slightest bit partisan here, I feel I can safely say that nothing you hear or see in the news – until after the elections — should be to taken as truth, nor be considered a substitute for cash money.
Something good (for me- and maybe you) DID happen Friday: I’d been wanting to sell soybean CALLs on the MAR19 and/or the MAY19 soybeans. As you see in the chart (below of MAR19 soybean futures), the price in this contract rose from below 860 cents to very near $9.00 / bushel suddenly.
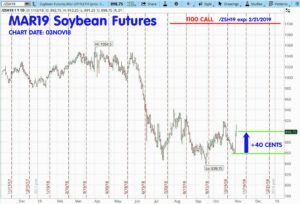
When I saw this, I immediately started shopping the 1100-strike MAR19 soybean CALL options; the last trade on Friday was 2.75 cents (50 x 2.75 = $137.50.) The BP Effect (buying-power-effect: my net initial margin required – SPAN minimum less the credit for selling the option) is about $350. This option expires on February 21, 2019, about 110 days away. The ROI, if I do not have any maintenance margin requirements, would be about 42% (150/340 x 100 = 42%.)
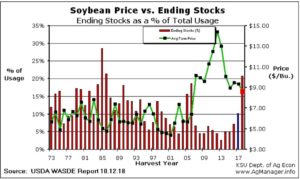
But that’s not all: As you may know, the average price for the season on soybeans (2018-2019) has been projected by the USDA/ WASDE to be just below $9.00 a bushel. (see Kansas State Univ. chart below, based on WASDE in Oct18 report.) I’ve put this chart up before, but here it is again for those of you who are new to this: (see the RED small square on the vertical red bar on the far right indicates projective avg. season-price just below $9.00. The GREEN line is avg. seasonal price.)
Here is the option matrix for the MARCH 2019 Soybean class (each month in options is a different “class”, like a graduating date class, etc.): I am looking at this matrix outside of trading hours, so the bid/ask is not accurate so I noted that. You should know anytime you view such a matrix outside of regular trading hours, these quotes are not reliable for trading. For a list of Trading Hours, see this Best (regular) Trading Hours for Selected Commodities and Options ARTICLE. Or you can DOWNLOAD it in XLS and customize it for your own time zone to print out. The download link is on the Resource: Links Library tab on this website.
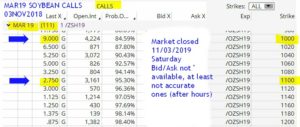
A week ago, I hesitated to sell the 1000 CALL in this class at near 3 to 4 cents. Today, selling the 1100-strike at around 3 cents looks like a good opportunity to me. I think selling the 1000-strike now is also attractive but personally, I prefer the safer 1100-strike, which I feel is even more out of reach (less risky, see the 95.30% Prob. OTM on the matrix.) Plus, all the rapid price movement has the IV% (implied volatility of the options) higher. Look at the “Open Int” or sometimes signified as “OI” for open interests. The 1000 is 4224 OI and the 1000 is 3161 OI, either plenty ample for trading. The OI is too low (in my opinion) on the 1020, 1060, and 1080 strikes. A higher OI is desired to ensure a trader gets fair pricing and liquidity.
Another thing happens this week on Thursday, November 8th at noon (Eastern/ New York time.): the NOV18 USDA / WASDE (World Ag Supply-Demand Estimates) monthly report is issued. With respect to soybeans, it is expected this report will (as it has been doing) reflect huge ending stocks, large yield, large production, and one of the highest STU (stocks-to-use ratio) ever. See the Soybean Price vs. STU chart above on this page(above). An STU this high (which means very large stocks and that’s bearish for prices) has not been seen since about 1986.
I want to tell you a fact about USDA reports: They do not consider daily news or any political speculation in their numbers. To be clear, I’m saying the current trade talks/dispute between USA/China are NOT factored into the numbers in these reports. They don’t do it now, they’ve never done it, and it is against all their policy to do such a thing. Doing otherwise, would make virtually all USDA reports much less reliable, so they just don’t do it for that reason. They also use consistent methodology, they keep it the same for all reports; this also increases the reliability of their works/reports. Also the people who issue these reports are confined in a private area with no cell phones (outside communications) and no people allowed in or out until AFTER the report is released (made public.) Read more about using USDA reports…
Corn: Corn prices went up at the same time as soybeans on Friday. DEC18 Corn futures were up 4.25 cents (about 1%, soybeans were up about 4.6% last week.) With the USDA/WASDE coming out Thursday a 12 pm (Eastern time), there could be another adjustment down for the expected yield of the corn crop, which was (already) reduced in the last report in October18. Usually, when it is reduced in October’s report, there are more yield reductions made as the harvest progresses in the next two months. If so, this would be bullish for corn. I am still shopping to sell PUT options on the JAN, MAR, MAY futures, the 2019’s of course.
Oil: Per the TFTB Newsletter for 01NOV2018, I took profits on my Crude Oil JAN19 90-strike CALLs, and also took profits on my APR19 100 CALLs. The remaining leg of those strangles, the PUTs are a little behind at present. My current plan is to again sell CALLs on Crude Oil at a lower strike and/or different class to get back to holding short CALLs on Crude Oil again. Remember, I like the short strangles, because there is no additional margin required (or very little) to hold the PUTS and the CALLs at the same time. I can sell both sides of a short strangle for the initial margin of whichever side is greater (not having to put up effectively two ‘initial margins.’)
Gold: I expect to see I’ve been filled on my GTC order (see 01NOV2018 newsletter) to close out my FEB19 1000 PUT, and when filled, I will shop to sell a higher strike PUT. I will be considering something around 1100 FEB19 to short. I am also considering selling a Gold PUT farther out than FEB19. I looked at them last week, and the OI is pretty thin right now, but I will keep checking. As the DEC18 Gold options expire the last week of NOV18, there should be more OI in the distant contacts developing. I will discuss this if/when I do something.
Natural Gas: As you know, I’m still holding a short DEC18 Natural Gas 3.750 CALL. I sold it for 0.017 ($170) on 21SEP2018. When this trade went against me, I decided to wait it out since the seasonal trend for NG DEC futures is undeniably DOWN for this time of year. This has been a rocky trade with some drawdown. If there is any good news here, it is that this option expires in three weeks (23 days actually) and this short CALL trading 0.025 at close on Friday. Soon NG prices will be going up; this often happens with very cold weather in Winter season for the North American cold season sets for the season. Usually, most of the swing UP in prices occurs in contracts farther out than DEC (the JAN and FEB contracts.) If I have to exit this trade, I’ll want to do it without going back to a large drawdown, as I tolerated over the last two months. I hope that smaller accounts that may have placed this trade, exited this trade per the “200% rule.” Caution would be my advice here for anyone that might be holding this trade. Having said that, I think it is time to start shopping for a JAN19 and/or farther out PUT to sell on NG. More on this soon.
There not a lot of new things this week, and with the possibility of more volatility ahead during this (USA) election week – I’ll be on the lookout for things that might get “over done” and try to find opportunity. The recent volatility of the stock market has those investors on a less certain foundation than has been felt in quite a while. Post-election may see crude oil prices regain some of the losses. With the stock market jitters in play, gold prices are subject to the ‘safe haven’ effect. So this week: I’m checking out the 1100 MAR19 soybean CALLs, selling more Crude Oil CALLs, Gold PUTs and/or strangles, and possibly Corn PUTs in the MAR 19/ MAY19 classes. Tuesday is election day. Thursday at noon (Eastern time) is WASDE report, here’s the link.
That is all today. Good trading to all. – Don

Don A. Singletary


Volatility Related to Politics and Soybeans:
Tomorrow, November 6th, is for the United States, election day. On Friday (02NOV18) – the USA President only hinted that his staff could be drafting a trade deal with China. Within the next 30 minutes, soybean prices advanced over 30 cents, and corn +7 cents. Larry Kudlow, now the Director of the National Economic Council under President Donald Trump – just four hours later publicly stated that no such trade agreement was being drafted at the White House. (” …the cabinet was not asked to draw up a trade deal with China….”.) Then, 3 hours later Kudlow stated, “Satisfactory Deal’ With China Could Lead to Lifting of Tariffs…”
Something good (for me- and maybe you) DID happen Friday: I’d been wanting to sell soybean CALLs on the MAR19 and/or the MAY19 soybeans. As you see in the chart (below of MAR19 soybean futures), the price in this contract rose from below 860 cents to very near $9.00 / bushel suddenly.
When I saw this, I immediately started shopping the 1100-strike MAR19 soybean CALL options; the last trade on Friday was 2.75 cents (50 x 2.75 = $137.50.) The BP Effect (buying-power-effect: my net initial margin required – SPAN minimum less the credit for selling the option) is about $350. This option expires on February 21, 2019, about 110 days away. The ROI, if I do not have any maintenance margin requirements, would be about 42% (150/340 x 100 = 42%.)
But that’s not all: As you may know, the average price for the season on soybeans (2018-2019) has been projected by the USDA/ WASDE to be just below $9.00 a bushel. (see Kansas State Univ. chart below, based on WASDE in Oct18 report.) I’ve put this chart up before, but here it is again for those of you who are new to this: (see the RED small square on the vertical red bar on the far right indicates projective avg. season-price just below $9.00. The GREEN line is avg. seasonal price.)
Here is the option matrix for the MARCH 2019 Soybean class (each month in options is a different “class”, like a graduating date class, etc.): I am looking at this matrix outside of trading hours, so the bid/ask is not accurate so I noted that. You should know anytime you view such a matrix outside of regular trading hours, these quotes are not reliable for trading. For a list of Trading Hours, see this Best (regular) Trading Hours for Selected Commodities and Options ARTICLE. Or you can DOWNLOAD it in XLS and customize it for your own time zone to print out. The download link is on the Resource: Links Library tab on this website.
A week ago, I hesitated to sell the 1000 CALL in this class at near 3 to 4 cents. Today, selling the 1100-strike at around 3 cents looks like a good opportunity to me. I think selling the 1000-strike now is also attractive but personally, I prefer the safer 1100-strike, which I feel is even more out of reach (less risky, see the 95.30% Prob. OTM on the matrix.) Plus, all the rapid price movement has the IV% (implied volatility of the options) higher. Look at the “Open Int” or sometimes signified as “OI” for open interests. The 1000 is 4224 OI and the 1000 is 3161 OI, either plenty ample for trading. The OI is too low (in my opinion) on the 1020, 1060, and 1080 strikes. A higher OI is desired to ensure a trader gets fair pricing and liquidity.
Another thing happens this week on Thursday, November 8th at noon (Eastern/ New York time.): the NOV18 USDA / WASDE (World Ag Supply-Demand Estimates) monthly report is issued. With respect to soybeans, it is expected this report will (as it has been doing) reflect huge ending stocks, large yield, large production, and one of the highest STU (stocks-to-use ratio) ever. See the Soybean Price vs. STU chart above on this page(above). An STU this high (which means very large stocks and that’s bearish for prices) has not been seen since about 1986.
Corn: Corn prices went up at the same time as soybeans on Friday. DEC18 Corn futures were up 4.25 cents (about 1%, soybeans were up about 4.6% last week.) With the USDA/WASDE coming out Thursday a 12 pm (Eastern time), there could be another adjustment down for the expected yield of the corn crop, which was (already) reduced in the last report in October18. Usually, when it is reduced in October’s report, there are more yield reductions made as the harvest progresses in the next two months. If so, this would be bullish for corn. I am still shopping to sell PUT options on the JAN, MAR, MAY futures, the 2019’s of course.
Oil: Per the TFTB Newsletter for 01NOV2018, I took profits on my Crude Oil JAN19 90-strike CALLs, and also took profits on my APR19 100 CALLs. The remaining leg of those strangles, the PUTs are a little behind at present. My current plan is to again sell CALLs on Crude Oil at a lower strike and/or different class to get back to holding short CALLs on Crude Oil again. Remember, I like the short strangles, because there is no additional margin required (or very little) to hold the PUTS and the CALLs at the same time. I can sell both sides of a short strangle for the initial margin of whichever side is greater (not having to put up effectively two ‘initial margins.’)
Gold: I expect to see I’ve been filled on my GTC order (see 01NOV2018 newsletter) to close out my FEB19 1000 PUT, and when filled, I will shop to sell a higher strike PUT. I will be considering something around 1100 FEB19 to short. I am also considering selling a Gold PUT farther out than FEB19. I looked at them last week, and the OI is pretty thin right now, but I will keep checking. As the DEC18 Gold options expire the last week of NOV18, there should be more OI in the distant contacts developing. I will discuss this if/when I do something.
Natural Gas: As you know, I’m still holding a short DEC18 Natural Gas 3.750 CALL. I sold it for 0.017 ($170) on 21SEP2018. When this trade went against me, I decided to wait it out since the seasonal trend for NG DEC futures is undeniably DOWN for this time of year. This has been a rocky trade with some drawdown. If there is any good news here, it is that this option expires in three weeks (23 days actually) and this short CALL trading 0.025 at close on Friday. Soon NG prices will be going up; this often happens with very cold weather in Winter season for the North American cold season sets for the season. Usually, most of the swing UP in prices occurs in contracts farther out than DEC (the JAN and FEB contracts.) If I have to exit this trade, I’ll want to do it without going back to a large drawdown, as I tolerated over the last two months. I hope that smaller accounts that may have placed this trade, exited this trade per the “200% rule.” Caution would be my advice here for anyone that might be holding this trade. Having said that, I think it is time to start shopping for a JAN19 and/or farther out PUT to sell on NG. More on this soon.
There not a lot of new things this week, and with the possibility of more volatility ahead during this (USA) election week – I’ll be on the lookout for things that might get “over done” and try to find opportunity. The recent volatility of the stock market has those investors on a less certain foundation than has been felt in quite a while. Post-election may see crude oil prices regain some of the losses. With the stock market jitters in play, gold prices are subject to the ‘safe haven’ effect. So this week: I’m checking out the 1100 MAR19 soybean CALLs, selling more Crude Oil CALLs, Gold PUTs and/or strangles, and possibly Corn PUTs in the MAR 19/ MAY19 classes. Tuesday is election day. Thursday at noon (Eastern time) is WASDE report, here’s the link.
That is all today. Good trading to all. – Don
Don A. Singletary
The commentary and examples are for teaching purposes only and are not intended to be a trading or trade advisory service. Any investments, trades, and/or speculations made in light of the ideas, opinions, and/or forecasts, expressed or implied herein on the web site and/or newsletter, are committed at your own risk, financial or otherwise. Trading with leverage could lead to greater loss than your initial deposit. Trade at your own risk. Investors and traders are responsible for their own investment/trading decisions including entries, exits, position, sizing and use of stops or lack thereof. This is not a trade advisory service and is for educational purposes only. The content on the pages here is believed to be reliable - but we cannot guarantee it.