Greetings: 29 July 2019 – Trade Commentary
DEC19 Corn closed at 424.25 on Friday. Many analyst are suggesting that because of vastly improved weather conditions – that it could continue a price decline this week and get down to the 400 to 410 range prior to the August 12th (Monday) USDA crop report (WASDE.) This report, as I have mentioned, will include new recent data of the survey of planted area.
Several times I have mentioned the possibility of selling some PUTs prior to the AUG report, but there isn’t enough premium down at strikes with 90% Prob OTM to do it. As of the close on Friday, the DEC19 360-strike PUT is at 90% Prob OTM, and last traded for 2.25 cents ($112.50.) I will be watching today at that strike and see what happens.
The reason I’m entertaining selling a DEC19 Corn PUT is that there is a very high probability that DEC19 Corn prices may run up prior to or AFTER the August 12th USDA report. Here’s a table from the CME (Chicago Mercantile Exchange) website with the numbers in last WASDE report in July:
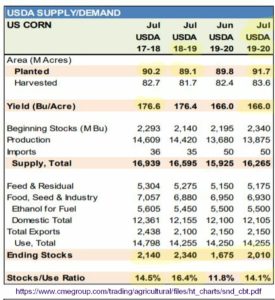
The JULY WASDE for the new crop (2019-2020), in spite of very late planting due to flooding did NOT reduce the planting area (acres) of corn. It is evident there won’t be the number (91.7 million acres) planted but when that report was issued, there was no data available to USDA to adjust the planted area, so they used “old” numbers, decided to do a special survey and said that some adjustment based on the survey would be in the August report. Something between a reduction of 5 to 8 million acres is expected. USDA may keep the projected yield (166 bushels/acres) the same and not adjust that part until the crop is more mature — but some reduction in planted area is certain to happen in August report. This would lower the carry-out projections (aka: ending stocks) and the Stocks/Use ratio will be lowered. If they reduced planted acres to 86.8 million and hold the yield to near 165, the Stocks/Use would drop down to about 9.8%. Now, look at the table below for the historical STU versus (avg to farm) PRICE:
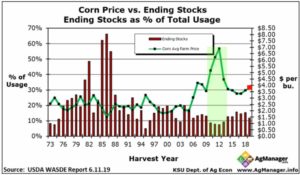
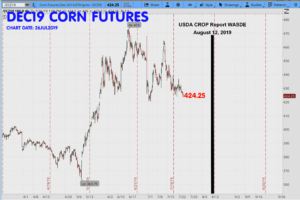
I have used this KSU chart before but I wanted to put this all on one-page – so it’s easier to follow. The highlighted GREEN area identifies the last time (2010-2012) when the Stocks/Use ratio was below 10%. The PRICE (green line) averaged above $5.00 a bushel for a couple of years. What I’m saying is the last time that STU dipped below 10% the average to-farm prices were above $5.00. That is what could happen this fall again. And if there is any pollination problems, bad weather such as little rain or temps that are too hot for ideal conditions – there is the potential for even higher prices. My personal take on this is that “there will almost certainly be higher prices than the present $424.25 but the dilemma at hand is the TIMING of all that.” I try to keep all the example trades I post here at 90% POP or Prob. OTM (probability of profit / prob. that the option will expire Out-of-the-Money.) If the analysts are correct, DEC19 price could drop more between now and the August 12th report (that date is marked on the DEC19 Corn chart below) – THEN I might be able to sell a PUT strike for enough to make a trade worthwhile.
For those of you totally new to Futures/Futures Options trading: This is a great example of using crops fundamentals (supply/demand/growing conditions/weather) to anticipate a price move. Such developments in fundamental data will usually over-ride technical indicators in an event – such as the details discussed here. It is easy to see why this is called “futures trading” because prices are reacting here based on the DEC19 delivery date (not the current cash price.) Here’s the DEC19 Corn chart:
Another dynamic of this DEC19 contract price is “what will happen to that price” once the harvest begins (in Norther Hemisphere/ USA) that is around the first week of September. Whatever peak price this DEC19 corn makes between now and then, prices – once the harvest begins – normally come down (since at harvest the growing risks are diminished.) This means that my selling a PUT basis the DEC19 contract, is not a trade I would even consider holding once the harvest begins. The expiration of the DEC19 class of corn options is: 11/22/2019.
There is another trade decision, I will have to make this season regarding DEC19 Corn prices. One of my favorite annual trades is to sell DEC Corn CALLS; I usually do this in early JUL for that is when a normal price peak occurs for this contract. This year is NOT normal at all (it’s counter-seasonal), so in order for me to sell CALLS on the DEC19 corn, I will need to anticipate WHEN the peak price is happening. Fortunately, since I am going to short CALLS far OTM, my goal will be merely to find CALL strike(s) high enough that they are not likely to be hit. As of today, since I cannot predict the future, I cannot say with certainty that I will be able to do that. However, I will certainly be waiting and watching for this opportunity. If prices spike and volatility does the same, I could be able to sell DEC19 Corn calls far above or near 600 -strikes and higher with good “Prob OTM” numbers.
Here’s the 15-year average HIGH/LOW timing patterns for the DEC Corn contract: (this pattern reflects what normally happens; this year it’s different of course.)
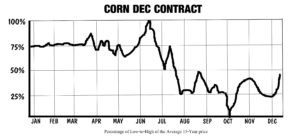 source: from my book: Seasonal Commodity Charts – Designed by Mother Nature available here at Amazon.
To summarize here: I hope to sell PUTS on price lows and CALLs on price highs. This is not as easy as it might sound, not while avoiding high risks. I would rather be trading in a normal season and its more predictable conditions, but the upside to current conditions is that we get to have a great example of ‘how to read fundamentals’ and ‘search for placements of strategic option sales.’ Trading futures, like all trading, will keep one humble. I am not arrogant enough to think I know what will happen, but I do have the experience to observe and recognize opportunity when it arrives.
The trades I post on this website are my real actual trades. I share my thinking, not expecting you to necessarily do the same or agree with me, but in order that you might be able to make decisions for your own trades by having been exposed to various scenarios. I often get emails from subscribers who tell me they trade more conservatively (usually selling options farther OTM than mine) and conversely, some are more aggressive. Most of the trades I feature here have good returns, and they should because this type of trading is more risky than many other strategies and the potential rewards should be higher. The downside of this type of trading is that the trader’s money-management I would say, has to be more disciplined than other styles of trading.
I have shared some “rules of thumb” with ideas about this in an article at my Selling Commodity Options blog, please see: RULES OF THUMB TRADING PSYCHOLOGY and MONEY MANAGEMENT. I put these links here once in a while, so if you’ve been a subscriber for a while, you may have already seen them.
If you are a new subscriber, you can see a list of my current positions in a recent post 25JULY2019 HERE.
Remember, you may go to the LINKS-RESOURCE page where you can always download a list of option expiration dates. These will be updated soon to include dates for calendar 2020.
Anytime you wish to ask me a question or leave a comment, just email me please. I’m always glad to hear from subscribers
Don@WriteThisDown.com
There isn’t much more to add right now. My recent comments on Gold and Crude Oil are up-to-date. I appreciate your support and I’m always glad to help when I can.
If you have a friend who might like to take a look at what we do here, please send them this link to the free 14-day trial. They will have immediate and full access the same as you, the moment they sign up (no credit card req.) HERE https://www.timefarming.com/blog/membership-levels/
That is all today. Have a great week. – Don

Don A. Singletary
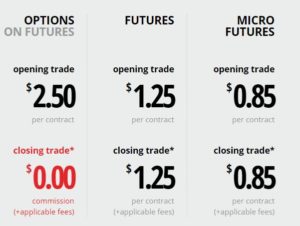
Thinking of opening a new account? TastyWorks has an easy-to-use platform that is easy to use with their one-page “See it, Click it, Trade it” format. SPAN minimum margins (the same I use), free software/quotes and a $2,000 minimum. Futures trades $2.50 round trip, futures options $1.25 per side, and the new Micro Futures trade for 85-cents per side.
Please use my affiliate link, I would appreciate that. TASTYWORKS Thank you.
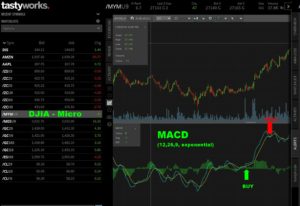
Here’s a screen shot from Friday of TastyWorks platform. I was playing around with one of the new Micro-Futures contracts, the DJIA micro futures, daytrade margin $150, commission 85 cents each way, and one-point of DOW avg = only $0.50. The Micro E-Mini S&P is only $5.00 per point (The regular E-mini is $50/point.) I made lunch money and had a little fun with them. I have a book on how to day-trade them them coming out in August. If you want to get on my mail list for notification, just email me at Don@WriteThisDown.com and put “micro” in subject line. Think or Swim charging me $2.00 per side for the Micros and TastyWorks only 85 cents per side, cheap!
have a good trading week. – Don
The commentary and examples are for teaching purposes only and are not intended to be a trading or trade advisory service. Any investments, trades, and/or speculations made in light of the ideas, opinions, and/or forecasts, expressed or implied herein on the web site and/or newsletter, are committed at your own risk, financial or otherwise. Trading with leverage could lead to greater loss than your initial deposit. Trade at your own risk. Investors and traders are responsible for their own investment/trading decisions including entries, exits, position, sizing and use of stops or lack thereof. This is not a trade advisory service and is for educational purposes only. The content on the pages here is believed to be reliable - but we cannot guarantee it.


Greetings: 29 July 2019 – Trade Commentary
DEC19 Corn closed at 424.25 on Friday. Many analyst are suggesting that because of vastly improved weather conditions – that it could continue a price decline this week and get down to the 400 to 410 range prior to the August 12th (Monday) USDA crop report (WASDE.) This report, as I have mentioned, will include new recent data of the survey of planted area.
Several times I have mentioned the possibility of selling some PUTs prior to the AUG report, but there isn’t enough premium down at strikes with 90% Prob OTM to do it. As of the close on Friday, the DEC19 360-strike PUT is at 90% Prob OTM, and last traded for 2.25 cents ($112.50.) I will be watching today at that strike and see what happens.
The reason I’m entertaining selling a DEC19 Corn PUT is that there is a very high probability that DEC19 Corn prices may run up prior to or AFTER the August 12th USDA report. Here’s a table from the CME (Chicago Mercantile Exchange) website with the numbers in last WASDE report in July:
The JULY WASDE for the new crop (2019-2020), in spite of very late planting due to flooding did NOT reduce the planting area (acres) of corn. It is evident there won’t be the number (91.7 million acres) planted but when that report was issued, there was no data available to USDA to adjust the planted area, so they used “old” numbers, decided to do a special survey and said that some adjustment based on the survey would be in the August report. Something between a reduction of 5 to 8 million acres is expected. USDA may keep the projected yield (166 bushels/acres) the same and not adjust that part until the crop is more mature — but some reduction in planted area is certain to happen in August report. This would lower the carry-out projections (aka: ending stocks) and the Stocks/Use ratio will be lowered. If they reduced planted acres to 86.8 million and hold the yield to near 165, the Stocks/Use would drop down to about 9.8%. Now, look at the table below for the historical STU versus (avg to farm) PRICE:
I have used this KSU chart before but I wanted to put this all on one-page – so it’s easier to follow. The highlighted GREEN area identifies the last time (2010-2012) when the Stocks/Use ratio was below 10%. The PRICE (green line) averaged above $5.00 a bushel for a couple of years. What I’m saying is the last time that STU dipped below 10% the average to-farm prices were above $5.00. That is what could happen this fall again. And if there is any pollination problems, bad weather such as little rain or temps that are too hot for ideal conditions – there is the potential for even higher prices. My personal take on this is that “there will almost certainly be higher prices than the present $424.25 but the dilemma at hand is the TIMING of all that.” I try to keep all the example trades I post here at 90% POP or Prob. OTM (probability of profit / prob. that the option will expire Out-of-the-Money.) If the analysts are correct, DEC19 price could drop more between now and the August 12th report (that date is marked on the DEC19 Corn chart below) – THEN I might be able to sell a PUT strike for enough to make a trade worthwhile.
For those of you totally new to Futures/Futures Options trading: This is a great example of using crops fundamentals (supply/demand/growing conditions/weather) to anticipate a price move. Such developments in fundamental data will usually over-ride technical indicators in an event – such as the details discussed here. It is easy to see why this is called “futures trading” because prices are reacting here based on the DEC19 delivery date (not the current cash price.) Here’s the DEC19 Corn chart:
Another dynamic of this DEC19 contract price is “what will happen to that price” once the harvest begins (in Norther Hemisphere/ USA) that is around the first week of September. Whatever peak price this DEC19 corn makes between now and then, prices – once the harvest begins – normally come down (since at harvest the growing risks are diminished.) This means that my selling a PUT basis the DEC19 contract, is not a trade I would even consider holding once the harvest begins. The expiration of the DEC19 class of corn options is: 11/22/2019.
There is another trade decision, I will have to make this season regarding DEC19 Corn prices. One of my favorite annual trades is to sell DEC Corn CALLS; I usually do this in early JUL for that is when a normal price peak occurs for this contract. This year is NOT normal at all (it’s counter-seasonal), so in order for me to sell CALLS on the DEC19 corn, I will need to anticipate WHEN the peak price is happening. Fortunately, since I am going to short CALLS far OTM, my goal will be merely to find CALL strike(s) high enough that they are not likely to be hit. As of today, since I cannot predict the future, I cannot say with certainty that I will be able to do that. However, I will certainly be waiting and watching for this opportunity. If prices spike and volatility does the same, I could be able to sell DEC19 Corn calls far above or near 600 -strikes and higher with good “Prob OTM” numbers.
Here’s the 15-year average HIGH/LOW timing patterns for the DEC Corn contract: (this pattern reflects what normally happens; this year it’s different of course.)
To summarize here: I hope to sell PUTS on price lows and CALLs on price highs. This is not as easy as it might sound, not while avoiding high risks. I would rather be trading in a normal season and its more predictable conditions, but the upside to current conditions is that we get to have a great example of ‘how to read fundamentals’ and ‘search for placements of strategic option sales.’ Trading futures, like all trading, will keep one humble. I am not arrogant enough to think I know what will happen, but I do have the experience to observe and recognize opportunity when it arrives.
The trades I post on this website are my real actual trades. I share my thinking, not expecting you to necessarily do the same or agree with me, but in order that you might be able to make decisions for your own trades by having been exposed to various scenarios. I often get emails from subscribers who tell me they trade more conservatively (usually selling options farther OTM than mine) and conversely, some are more aggressive. Most of the trades I feature here have good returns, and they should because this type of trading is more risky than many other strategies and the potential rewards should be higher. The downside of this type of trading is that the trader’s money-management I would say, has to be more disciplined than other styles of trading.
I have shared some “rules of thumb” with ideas about this in an article at my Selling Commodity Options blog, please see: RULES OF THUMB TRADING PSYCHOLOGY and MONEY MANAGEMENT. I put these links here once in a while, so if you’ve been a subscriber for a while, you may have already seen them.
If you are a new subscriber, you can see a list of my current positions in a recent post 25JULY2019 HERE.
Remember, you may go to the LINKS-RESOURCE page where you can always download a list of option expiration dates. These will be updated soon to include dates for calendar 2020.
Anytime you wish to ask me a question or leave a comment, just email me please. I’m always glad to hear from subscribers
Don@WriteThisDown.com
There isn’t much more to add right now. My recent comments on Gold and Crude Oil are up-to-date. I appreciate your support and I’m always glad to help when I can.
If you have a friend who might like to take a look at what we do here, please send them this link to the free 14-day trial. They will have immediate and full access the same as you, the moment they sign up (no credit card req.) HERE https://www.timefarming.com/blog/membership-levels/
That is all today. Have a great week. – Don

Don A. Singletary
Thinking of opening a new account? TastyWorks has an easy-to-use platform that is easy to use with their one-page “See it, Click it, Trade it” format. SPAN minimum margins (the same I use), free software/quotes and a $2,000 minimum. Futures trades $2.50 round trip, futures options $1.25 per side, and the new Micro Futures trade for 85-cents per side.
Please use my affiliate link, I would appreciate that. TASTYWORKS Thank you.
Here’s a screen shot from Friday of TastyWorks platform. I was playing around with one of the new Micro-Futures contracts, the DJIA micro futures, daytrade margin $150, commission 85 cents each way, and one-point of DOW avg = only $0.50. The Micro E-Mini S&P is only $5.00 per point (The regular E-mini is $50/point.) I made lunch money and had a little fun with them. I have a book on how to day-trade them them coming out in August. If you want to get on my mail list for notification, just email me at Don@WriteThisDown.com and put “micro” in subject line. Think or Swim charging me $2.00 per side for the Micros and TastyWorks only 85 cents per side, cheap!
have a good trading week. – Don
The commentary and examples are for teaching purposes only and are not intended to be a trading or trade advisory service. Any investments, trades, and/or speculations made in light of the ideas, opinions, and/or forecasts, expressed or implied herein on the web site and/or newsletter, are committed at your own risk, financial or otherwise. Trading with leverage could lead to greater loss than your initial deposit. Trade at your own risk. Investors and traders are responsible for their own investment/trading decisions including entries, exits, position, sizing and use of stops or lack thereof. This is not a trade advisory service and is for educational purposes only. The content on the pages here is believed to be reliable - but we cannot guarantee it.