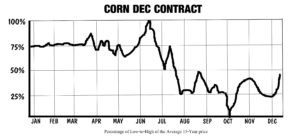
Corn: This is a follow up to comments posted here on October 11, 2018 under the heading Corn. Since the WASDE report on Thursday, 11OCT18, the DEC18 Corn futures closed on Friday at 373.25. In my comments on 11 OCT in Trade Commentary, I cited that the differences in both the USA and WORLD corn supply-demand were not changed much at all. The fact that there is a significant net short position (COT) on DEC18 corn futures and the slight rise in prices the two days after the WASDE report could indicate some short covering in the DEC18 contract. While 15-year average price pattern of DEC Corn futures (chart below) indicates a huge price drop from JULY to OCT, it also indicates an average bottom in OCT followed by a nominal price rise. So to have DEC18 futures rise from a low, is not unusual. I mentioned in my comments on 11 OCT that:
“…The DEC18 futures bounced up 6.00 cents today, but still the price of the DEC18 futures at 369.00 is probably safely below the $4.00-strike CALLs on this contract. I will still be watching these 400-strikes (and other strikes) closely; it is not out of the question that today’s report that lowered yield, could portend further reductions as the harvest progresses.”
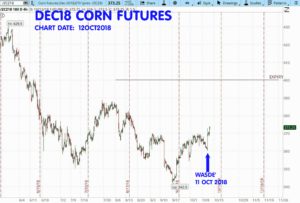
As you saw, DEC18 corn was up Friday, now up about 10 cents since the WASDE (supply-demand) report. The facts of the fundamentals, at this time, don’t support much of a move UP. However, one cannot rule out some effects of short-covering, or the possibility of supportive price news from the CROP PROGRESS REPORT(S), or the NOV18 WASDE possible revisions.
Here’s the link to the CROP PROGRESS REPORTS
Although, I do not hold any short Corn DEC18 400C’s, here’s the DEC18 Corn futures chart for your reference should you need it:
I have begun shopping some 2019 Corn PUTs, probably something on MAR18, which has a strong tendency for prices to rise from an early bottom during the harvest of this year. Here’s a look at the MAR Corn 15-year average price pattern:
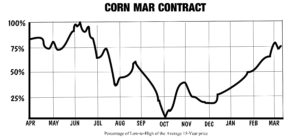
It might be that the MAR2019 Corn contract could be near a low now or very soon. With ending stocks trending lower in the long-term view (a bullish tilt for the new crop), the could mean strength in MAR19 corn futures in early calendar 2019. This time period in North America’s seasons has harvesting ending in NOV18 and new crop planting in MAR-MAY of 2019. During this time period, all the harvest is done and “future corn” all the “new crop” for 2018-2019 will be in-the-ground and at risk; there is a very strong price pattern for Corn prices to rise after harvest into the Spring/Summer months (MAR through JUL.) So in order to shop to sell some PUTs on the MAR2019 contract, the goal for we option-sellers is to sell prior to this seasonal rise in prices. The earlier we can place this trade, the more time-premium we might get for the option sale.
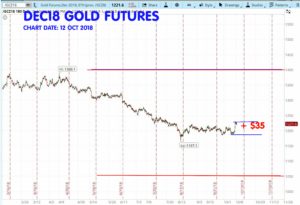
Gold: The sharp and sudden drop in the S&P500 & DOW Averages this past week, popped DEC18 (and other contracts too) up by about $US 35.00/ounce. An example and reminder of how a ‘safe haven’ price spike could be. This is a reference of how “money goes from stocks to gold” when stock sentiments droop. Since economic indicators continue to be strong, I’m in the camp that doesn’t yet believe a bear stock market is imminent, I suspect any short term ‘safe haven’ action will not (yet) be enough to keep gold prices from dropping a bit from here. While the uncertainty does make me want to keep any new short strangles on gold as wide as possible, the long-term could bring some interest rate hike-talk, which would portend dollar strength and gold prices dropping a bit from present levels. Fortunately, wide short strangles don’t require me to be completely correct about this assumption in order to make a nice profit. Only 44 days until my short 1400 CALL and 1050 PUT expire, and with DEC18 gold trading near $1221, I remain far OTM with a short time to go. Having said that, I will not rule out an exit with a nice profit before the expiration date of 27NOV2018.
Natural Gas: DEC18 as you can see (chart below) has a huge spike UP during hurricane Michael in USA/Florida, only to settle .200 off the high after the weather passed by end of day, Friday 12OCT2018 near 3.209. My short DEC18 NG 3.750 CALLs are on the chart below:
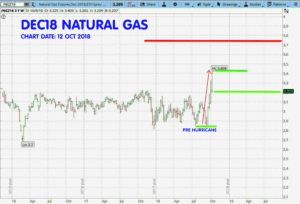
As soon as these DEC18 CALLs come back in line a little, I will start shopping for NG short CALL and/or strangles for JAN 2019 and beyond.
Crude Oil: Selling Strangles on the April 2019 Crude Oil Futures
Here’s a trade that I will probably place soon, if not this week (I may change the strikes a little, depending on prices): Short strangles: Selling a CALL and a PUT on a futures contract at the same time. Since both legs of this spread cannot be In-the-Money (ITM) at the same time, the initial margin requirement for this strategy is low. It’s like getting to sell two options for the margin requirement of only one. This increases the ROI (return on investment.) Over the last 14 months, I have shorted strangles on crude oil many times – and they have been quite profitable. Currently, I am short DEC18 85 and 90-strike CALLs and the 55-strike PUT, and also short the JAN19 90-strike CALL and the 50-strike PUT.
The high time-value of the farther out April 2019 class for Crude Oil options offers some opportunity. This class expires in about 154 days on March 14, 2019. Please notice the EXPIRATION of the named MONTH options, expire in the month prior; for example the APR19 options expire in MAR19, the JAN19’s expire in DEC18….and so on.

Option Expiration Dates for Crude Oil
In shopping for options to sell on the APR19 Crude Oil, I want to take a look at see how much more premium I can get selling the APR19, instead of an earlier classes (the JAN19, FEB19, and FEB19). For reasons I have previously discussed in this forum, I think the 100 CALLs and the 50 PUTs for a short strangle pair would be relatively safe.
At present the short 100C/50P JAN19 options are priced at a total of: 0.08 or $80. Days until Expiration: 63
At present the short 100C/50P FEB19 options are priced at a total of: 0.17 or $170. Days until Expiration: 96
At present the short 100C/50P MAR19 options are priced at a total of: 0.29 or $290. Days until Expiration: 125
At present the short 100C/50P APR19 options are priced at a total of: 0.43 or $430. Days until Expiration: 154
In the decision-making process, as we study the premium collection for these different classes (dates), we always must consider that there is a trade-off for selling options farther out in time to those more ‘near by.’ Selling the APR19 class will pay $430 for the same strikes of the short strangle, but there is also considerably more time in which things could happen to go against the trade (creating more risk).
When I bring up selling the APR19 short strangle 100 CALL and 50 PUT, the trade pop-up window in TOS – indicates the “Buying Power Effect” will be $730. Since I am collecting $430 in premium, the initial margin required for the trade is near $730 + $430 = $1160, and the NET effect, called the “buying power effect” in ThinkOrSwim, is $730. This is the $1160 minus the CREDIT for selling the strangle.
This is a potential Return On Investment (ROI) of about $430/$730 = .589 or 58.9%. It is possible that I might be required to post additional margin maintenance during the trade; this is because there could be additional margin requirements (or less) as the trade is marked-to-the-market during its time period. (If you have a question about marked-to-the-market or maintenance margin requirements, discuss it with your broker.) Because this is the initial margin – and since trades are subject to additional margin maintenance, it isn’t 100% accurate to state the ROI as 58.9% without noting it could be more or less depending on margin deposits required during the trade. In theory, even if the margin requirements doubled during this trade, the ROI would still be around a 30% return in about five months, a very attractive return.
To be truly practical in describing this trade, I have to consider other scenarios: For example: If I have the opportunity to keep 50% of the premium after four months in this trade, I might decide to close the trade out rather than risking this profit while trying to hold out for a more profit. If this were the case, I might – for example- profit half of the $430, about $215 in four months. Using the initial margin requirement, this would be an ROI of about $215/$730 = 29.4% in 120 days, an annualized rate of about 88%. The fact that these high returns could be available – is due to the very high leverage of trading when using options on commodities. This is why option-writing premiums are generally very much higher on commodities than in the stock market. We have to monitor our trades and often this means evaluating and re-evaluating our trades over the time we hold them. There is no “set it and forget it” in this type of trading. If we are willing to do these evaluations and take the risk, the potential of high returns is available to us.
Now, let’s take a look at the statistical risk. I say “statistical risk” because the ThinkOrSwim software (as well as some other platforms) allow us to use a formula similar to the Black-Scholes to derive the “Prob. OTM” – the Probability the options will expire Out-of-the-Money (OTM.)
The “Prob. of OTM” does NOT consider a market’s fundamentals, it only uses:
- The volatility of the underlying contract
- The distance the option’s strike and price of the underlying
- Current interest rates
- And the option’s value
This calculates a likely percentage based on the distribution of probability curve – similar to what you may know as a Bell curve.)
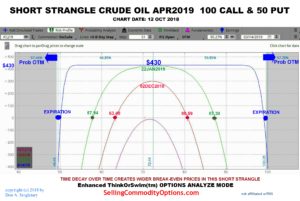
Note in the illustration below that there is a “Prob. OTM” of over 97% of either the 100-strike CALL or the 50-strike PUT being OTM at expiry on 3/14/2019. I used the Analyze Mode of TOS platform – and I manually color-coded and marked selected dates and prices to make it easier to read for those of you who are not familiar with this type of diagram. RED shows the P/L for the December 2, 2018. The GREEN is P/L for January 22, 2019, and the BLUE is at expiration on 3/14/2019. The exact BE (break-even) points at expiry (not incl. commissions) are: 50 minus 0.43, and 100 plus 0.43.
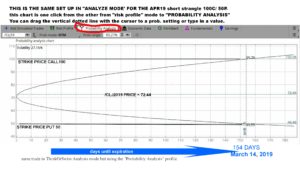
Just so you know, it is not necessary that you always do a chart like this one in order to analyze and select trades. However, using and seeing illustrations like this one, is the absolute very best and quickest way to learn about various option strategies. Here (below) is the “Probability Analysis” profile mode of TOS’s Analyze mode:
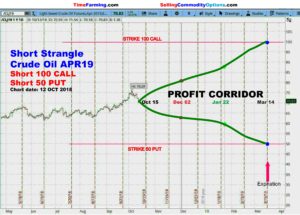
And this chart (below) is the easiest of all. It’s a diagram I developed to use to explain option trades to my commercial hedge clients. It simply superimposes a dated profit corridor over a time-price chart: This illustration is an approximation and does not consider changes in Implied Volatility (IV%) of the options. Since this trade is short options, increased IV% would narrow the profit corridor, and decreasing IV% would widen this corridor.
If you are new to our newsletter and to commodity option selling, please don’t be intimidated by all the charts in this Crude Oil short strangle. Be patient and keep following along, you will learn much faster and sooner than you probably imagine. The hardest part is just getting used to the new vocabulary. The principles of selling options are simple, but learning the lingo takes a while. I always remind neophytes to just study three or four markets at first; once you do that – you’ll begin to recognize many of the terms. There is no need for you to learn ALL the markets anyway. Most traders won’t trade over five or six of them in a lifetime, so there’s no need to rush confusion by trying to learn it all up front. Studying the trade examples in the newsletter and reading over some past trade discussions and ideas on the the blog at https://SellingCommodityOptions.com, is all you need.
I will send out an email notification if/when I place new trades this week and/or close any existing.
The most recent newsletter can be downloaded at this link: 24SEP2018: DOWNLOAD
It has a ‘Trade Summary Sheet” with all the current positions. A new newsletter is posted when there are new trades, any modifications, and/or closing trades. The Trade Commentary is on Mondays and sometimes at mid-week also.
Thank you and have a great week. – Don

Don A. Singletary
(c)2018 by Don A. Singletary Copying & distribution of the material in any form is not allowed without prior written permission under penalty of applicable international copyright laws. thank you.
The commentary and examples are for teaching purposes only and are not intended to be a trading or trade advisory service. Any investments, trades, and/or speculations made in light of the ideas, opinions, and/or forecasts, expressed or implied herein on the web site and/or newsletter, are committed at your own risk, financial or otherwise. Trading with leverage could lead to greater loss than your initial deposit. Trade at your own risk. Investors and traders are responsible for their own investment/trading decisions including entries, exits, position, sizing and use of stops or lack thereof. This is not a trade advisory service and is for educational purposes only. The content on the pages here is believed to be reliable - but we cannot guarantee it.


Corn: This is a follow up to comments posted here on October 11, 2018 under the heading Corn. Since the WASDE report on Thursday, 11OCT18, the DEC18 Corn futures closed on Friday at 373.25. In my comments on 11 OCT in Trade Commentary, I cited that the differences in both the USA and WORLD corn supply-demand were not changed much at all. The fact that there is a significant net short position (COT) on DEC18 corn futures and the slight rise in prices the two days after the WASDE report could indicate some short covering in the DEC18 contract. While 15-year average price pattern of DEC Corn futures (chart below) indicates a huge price drop from JULY to OCT, it also indicates an average bottom in OCT followed by a nominal price rise. So to have DEC18 futures rise from a low, is not unusual. I mentioned in my comments on 11 OCT that:
As you saw, DEC18 corn was up Friday, now up about 10 cents since the WASDE (supply-demand) report. The facts of the fundamentals, at this time, don’t support much of a move UP. However, one cannot rule out some effects of short-covering, or the possibility of supportive price news from the CROP PROGRESS REPORT(S), or the NOV18 WASDE possible revisions.
Dates of next CROP PROGRESS REPORTS GRAINS
Here’s the link to the CROP PROGRESS REPORTS
Although, I do not hold any short Corn DEC18 400C’s, here’s the DEC18 Corn futures chart for your reference should you need it:
I have begun shopping some 2019 Corn PUTs, probably something on MAR18, which has a strong tendency for prices to rise from an early bottom during the harvest of this year. Here’s a look at the MAR Corn 15-year average price pattern:
It might be that the MAR2019 Corn contract could be near a low now or very soon. With ending stocks trending lower in the long-term view (a bullish tilt for the new crop), the could mean strength in MAR19 corn futures in early calendar 2019. This time period in North America’s seasons has harvesting ending in NOV18 and new crop planting in MAR-MAY of 2019. During this time period, all the harvest is done and “future corn” all the “new crop” for 2018-2019 will be in-the-ground and at risk; there is a very strong price pattern for Corn prices to rise after harvest into the Spring/Summer months (MAR through JUL.) So in order to shop to sell some PUTs on the MAR2019 contract, the goal for we option-sellers is to sell prior to this seasonal rise in prices. The earlier we can place this trade, the more time-premium we might get for the option sale.
Gold: The sharp and sudden drop in the S&P500 & DOW Averages this past week, popped DEC18 (and other contracts too) up by about $US 35.00/ounce. An example and reminder of how a ‘safe haven’ price spike could be. This is a reference of how “money goes from stocks to gold” when stock sentiments droop. Since economic indicators continue to be strong, I’m in the camp that doesn’t yet believe a bear stock market is imminent, I suspect any short term ‘safe haven’ action will not (yet) be enough to keep gold prices from dropping a bit from here. While the uncertainty does make me want to keep any new short strangles on gold as wide as possible, the long-term could bring some interest rate hike-talk, which would portend dollar strength and gold prices dropping a bit from present levels. Fortunately, wide short strangles don’t require me to be completely correct about this assumption in order to make a nice profit. Only 44 days until my short 1400 CALL and 1050 PUT expire, and with DEC18 gold trading near $1221, I remain far OTM with a short time to go. Having said that, I will not rule out an exit with a nice profit before the expiration date of 27NOV2018.
Natural Gas: DEC18 as you can see (chart below) has a huge spike UP during hurricane Michael in USA/Florida, only to settle .200 off the high after the weather passed by end of day, Friday 12OCT2018 near 3.209. My short DEC18 NG 3.750 CALLs are on the chart below:
As soon as these DEC18 CALLs come back in line a little, I will start shopping for NG short CALL and/or strangles for JAN 2019 and beyond.
Crude Oil: Selling Strangles on the April 2019 Crude Oil Futures
Here’s a trade that I will probably place soon, if not this week (I may change the strikes a little, depending on prices): Short strangles: Selling a CALL and a PUT on a futures contract at the same time. Since both legs of this spread cannot be In-the-Money (ITM) at the same time, the initial margin requirement for this strategy is low. It’s like getting to sell two options for the margin requirement of only one. This increases the ROI (return on investment.) Over the last 14 months, I have shorted strangles on crude oil many times – and they have been quite profitable. Currently, I am short DEC18 85 and 90-strike CALLs and the 55-strike PUT, and also short the JAN19 90-strike CALL and the 50-strike PUT.
The high time-value of the farther out April 2019 class for Crude Oil options offers some opportunity. This class expires in about 154 days on March 14, 2019. Please notice the EXPIRATION of the named MONTH options, expire in the month prior; for example the APR19 options expire in MAR19, the JAN19’s expire in DEC18….and so on.
Option Expiration Dates for Crude Oil
In shopping for options to sell on the APR19 Crude Oil, I want to take a look at see how much more premium I can get selling the APR19, instead of an earlier classes (the JAN19, FEB19, and FEB19). For reasons I have previously discussed in this forum, I think the 100 CALLs and the 50 PUTs for a short strangle pair would be relatively safe.
At present the short 100C/50P JAN19 options are priced at a total of: 0.08 or $80. Days until Expiration: 63
At present the short 100C/50P FEB19 options are priced at a total of: 0.17 or $170. Days until Expiration: 96
At present the short 100C/50P MAR19 options are priced at a total of: 0.29 or $290. Days until Expiration: 125
At present the short 100C/50P APR19 options are priced at a total of: 0.43 or $430. Days until Expiration: 154
In the decision-making process, as we study the premium collection for these different classes (dates), we always must consider that there is a trade-off for selling options farther out in time to those more ‘near by.’ Selling the APR19 class will pay $430 for the same strikes of the short strangle, but there is also considerably more time in which things could happen to go against the trade (creating more risk).
When I bring up selling the APR19 short strangle 100 CALL and 50 PUT, the trade pop-up window in TOS – indicates the “Buying Power Effect” will be $730. Since I am collecting $430 in premium, the initial margin required for the trade is near $730 + $430 = $1160, and the NET effect, called the “buying power effect” in ThinkOrSwim, is $730. This is the $1160 minus the CREDIT for selling the strangle.
This is a potential Return On Investment (ROI) of about $430/$730 = .589 or 58.9%. It is possible that I might be required to post additional margin maintenance during the trade; this is because there could be additional margin requirements (or less) as the trade is marked-to-the-market during its time period. (If you have a question about marked-to-the-market or maintenance margin requirements, discuss it with your broker.) Because this is the initial margin – and since trades are subject to additional margin maintenance, it isn’t 100% accurate to state the ROI as 58.9% without noting it could be more or less depending on margin deposits required during the trade. In theory, even if the margin requirements doubled during this trade, the ROI would still be around a 30% return in about five months, a very attractive return.
To be truly practical in describing this trade, I have to consider other scenarios: For example: If I have the opportunity to keep 50% of the premium after four months in this trade, I might decide to close the trade out rather than risking this profit while trying to hold out for a more profit. If this were the case, I might – for example- profit half of the $430, about $215 in four months. Using the initial margin requirement, this would be an ROI of about $215/$730 = 29.4% in 120 days, an annualized rate of about 88%. The fact that these high returns could be available – is due to the very high leverage of trading when using options on commodities. This is why option-writing premiums are generally very much higher on commodities than in the stock market. We have to monitor our trades and often this means evaluating and re-evaluating our trades over the time we hold them. There is no “set it and forget it” in this type of trading. If we are willing to do these evaluations and take the risk, the potential of high returns is available to us.
Now, let’s take a look at the statistical risk. I say “statistical risk” because the ThinkOrSwim software (as well as some other platforms) allow us to use a formula similar to the Black-Scholes to derive the “Prob. OTM” – the Probability the options will expire Out-of-the-Money (OTM.)
Note in the illustration below that there is a “Prob. OTM” of over 97% of either the 100-strike CALL or the 50-strike PUT being OTM at expiry on 3/14/2019. I used the Analyze Mode of TOS platform – and I manually color-coded and marked selected dates and prices to make it easier to read for those of you who are not familiar with this type of diagram. RED shows the P/L for the December 2, 2018. The GREEN is P/L for January 22, 2019, and the BLUE is at expiration on 3/14/2019. The exact BE (break-even) points at expiry (not incl. commissions) are: 50 minus 0.43, and 100 plus 0.43.
Just so you know, it is not necessary that you always do a chart like this one in order to analyze and select trades. However, using and seeing illustrations like this one, is the absolute very best and quickest way to learn about various option strategies. Here (below) is the “Probability Analysis” profile mode of TOS’s Analyze mode:
And this chart (below) is the easiest of all. It’s a diagram I developed to use to explain option trades to my commercial hedge clients. It simply superimposes a dated profit corridor over a time-price chart: This illustration is an approximation and does not consider changes in Implied Volatility (IV%) of the options. Since this trade is short options, increased IV% would narrow the profit corridor, and decreasing IV% would widen this corridor.
If you are new to our newsletter and to commodity option selling, please don’t be intimidated by all the charts in this Crude Oil short strangle. Be patient and keep following along, you will learn much faster and sooner than you probably imagine. The hardest part is just getting used to the new vocabulary. The principles of selling options are simple, but learning the lingo takes a while. I always remind neophytes to just study three or four markets at first; once you do that – you’ll begin to recognize many of the terms. There is no need for you to learn ALL the markets anyway. Most traders won’t trade over five or six of them in a lifetime, so there’s no need to rush confusion by trying to learn it all up front. Studying the trade examples in the newsletter and reading over some past trade discussions and ideas on the the blog at https://SellingCommodityOptions.com, is all you need.
I will send out an email notification if/when I place new trades this week and/or close any existing.
The most recent newsletter can be downloaded at this link: 24SEP2018: DOWNLOAD
It has a ‘Trade Summary Sheet” with all the current positions. A new newsletter is posted when there are new trades, any modifications, and/or closing trades. The Trade Commentary is on Mondays and sometimes at mid-week also.
Thank you and have a great week. – Don
Don A. Singletary
(c)2018 by Don A. Singletary Copying & distribution of the material in any form is not allowed without prior written permission under penalty of applicable international copyright laws. thank you.
The commentary and examples are for teaching purposes only and are not intended to be a trading or trade advisory service. Any investments, trades, and/or speculations made in light of the ideas, opinions, and/or forecasts, expressed or implied herein on the web site and/or newsletter, are committed at your own risk, financial or otherwise. Trading with leverage could lead to greater loss than your initial deposit. Trade at your own risk. Investors and traders are responsible for their own investment/trading decisions including entries, exits, position, sizing and use of stops or lack thereof. This is not a trade advisory service and is for educational purposes only. The content on the pages here is believed to be reliable - but we cannot guarantee it.